


The graph shows percent changes of the different locations compared with the baseline of January 2020 before the lockdowns.
Metro Davao mobility
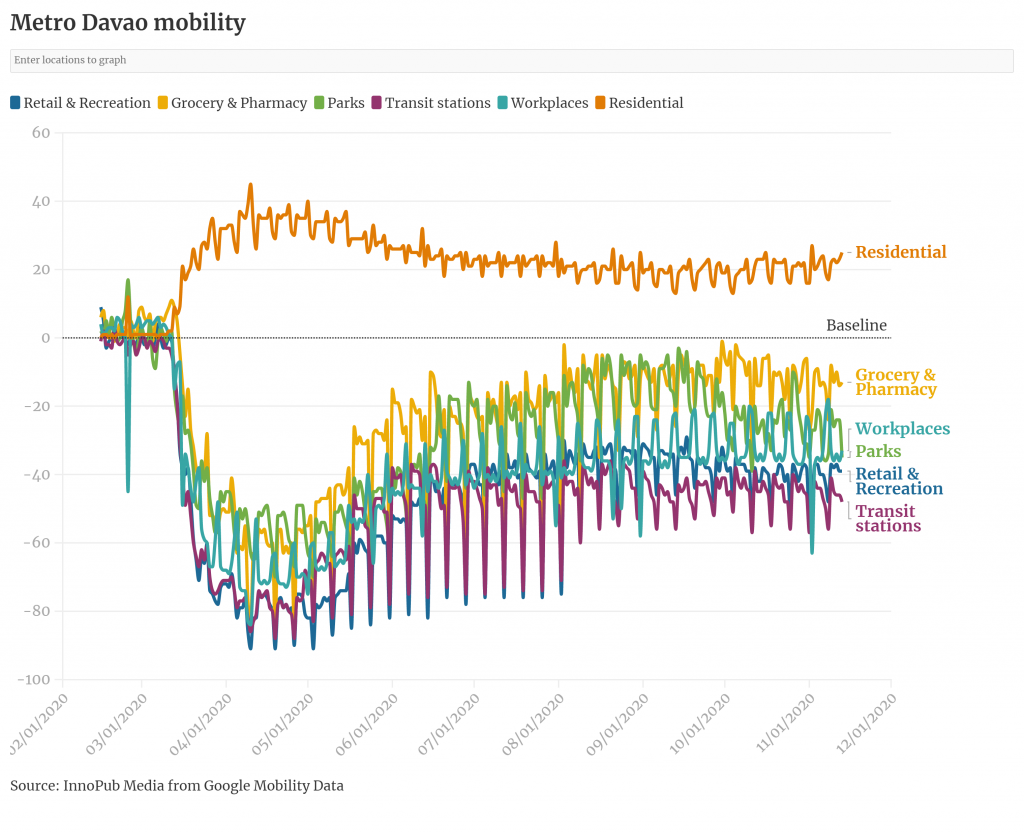
The graph shows percent changes of the different locations compared with the baseline of January 2020 before the lockdowns.

